Setup
Loading the R libraries, data set, and a shapefile for the USA.
Show code
Downloading file 1 of 1: `post_offices.csv`Show code
# Loading USA shapefile
usa_shapefile <- read_sf("~/TidyTuesday/data/States_shapefile-shp/")
Wrangling data for visualisation.
Show code
# Creating a filtered, tidy tibble with one row per post office with coordinates
post_office_est <- tt$post_offices %>%
  filter(coordinates == TRUE) %>%
  filter(!is.na(established)) %>%
  filter(established >= 1772 & established <= 2021) %>%
  filter(longitude <= 100) %>%
  filter(!is.na(stamp_index) & stamp_index <= 9) %>%
  select(established, latitude, longitude, stamp_index)

post_office_est$established <- post_office_est$established %>% as.integer()
Plotting US post offices from 1772 to 2000
In this section, post offices in the USA are plotted in the order they were established. This animation begins in the 1772 and ends in 2000. Each point represents one post office, with the colour of each point corresponding to the scarcity of postmarks from that post office. The lighter the point, the rarer the postmark. The order in which post offices are established follows the colonisation of America, with post offices first appearing on the east coast before moving west.
Show code
# Creating an animation with one point per post office from 1772 to 2000
p <- ggplot(usa_shapefile) +
  geom_sf() +
  geom_point(aes(longitude, latitude, colour = stamp_index),
             data = post_office_est) +
  scale_fill_continuous(type = "gradient") +
  transition_time(established, range = c(1772L, 2000L)) +
  ease_aes("linear") +
  theme_void() +
  theme(legend.position = "none") +
  labs(title = "Post offices established each year in the US",
       subtitle = "Lighter points indicate rarer postmarks. Year: {frame_time}")

# Rendering the animation as a .gif
animate(p, nframes = 400, fps = 5, renderer = magick_renderer())
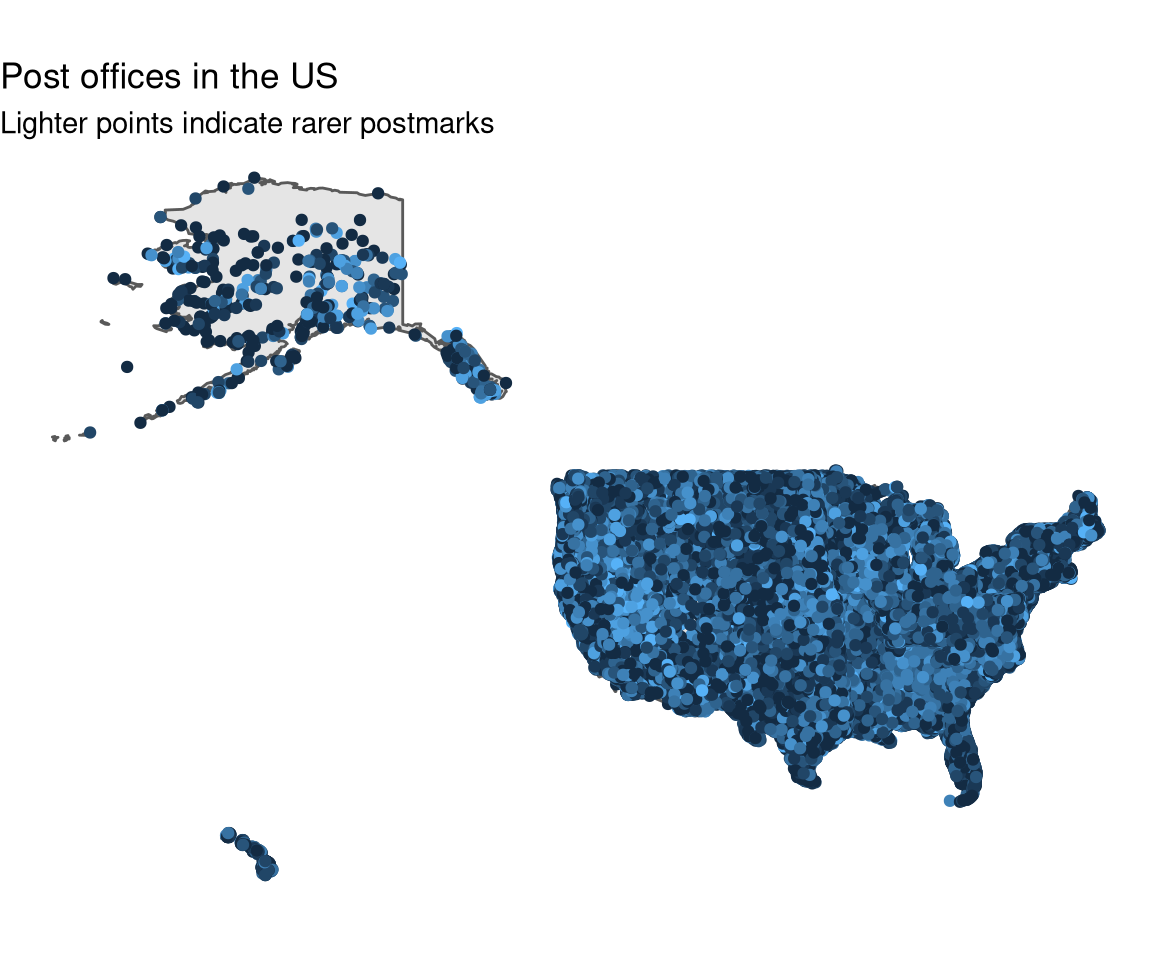
Here are all these post offices in one static plot.
Show code
# All the post offices on the USA shapefile in a static plot
ggplot(usa_shapefile) +
  geom_sf() +
  geom_point(aes(longitude, latitude, colour = stamp_index),
             data = post_office_est) +
  scale_fill_continuous(type = "gradient") +
  theme_void() +
  theme(legend.position = "none") +
  labs(title = "Post offices in the US",
       subtitle = "Lighter points indicate rarer postmarks")