Introduction
In this post, the Technology Adoption data set is used to illustrate data exploration R and adding information using the {countrycode} package. During data exploration, the tt$technology data set is filtered to select for the “Energy” category, and the distinct values for “variable” and “label” are printed. A subset is then created to test adding full country names and corresponding continents based on 3 letter ISO codes in the data set using the countrycode() function. The full data set is then wrangled into two tibbles for fossil fuel and low-carbon electricity production: the distribution for each energy source is plotted according to the corresponding continent. The full source for this blog post is available on GitHub.
Setup
Loading the R libraries and data set.
# Loading libraries
library(tidytuesdayR)
library(countrycode)
library(tidyverse)
library(ggthemes)

# Loading data
tt <- tt_load("2022-07-19")
Downloading file 1 of 1: `technology.csv`Exploring tt$technology: selecting distinct values after filtering, and testing adding a “continent” variable
# Printing a summary of tt$technology
tt$technology
# A tibble: 491,636 × 7
variable label iso3c year group categ…¹ value
<chr> <chr> <chr> <dbl> <chr> <chr> <dbl>
1 BCG % children who received a… AFG 1982 Cons… Vaccin… 10
2 BCG % children who received a… AFG 1983 Cons… Vaccin… 10
3 BCG % children who received a… AFG 1984 Cons… Vaccin… 11
4 BCG % children who received a… AFG 1985 Cons… Vaccin… 17
5 BCG % children who received a… AFG 1986 Cons… Vaccin… 18
6 BCG % children who received a… AFG 1987 Cons… Vaccin… 27
7 BCG % children who received a… AFG 1988 Cons… Vaccin… 40
8 BCG % children who received a… AFG 1989 Cons… Vaccin… 38
9 BCG % children who received a… AFG 1990 Cons… Vaccin… 30
10 BCG % children who received a… AFG 1991 Cons… Vaccin… 21
# … with 491,626 more rows, and abbreviated variable name ¹category
# ℹ Use `print(n = ...)` to see more rows# Printing the distinct "variable" and "label" pairs for the "Energy" category
## This will be used as a reference to create the "energy_type" column/variable
tt$technology %>% filter(category == "Energy") %>% select(variable, label) %>%
distinct()# A tibble: 11 × 2
variable label
<chr> <chr>
1 elec_coal Electricity from coal (TWH)
2 elec_cons Electric power consumption (KWH)
3 elec_gas Electricity from gas (TWH)
4 elec_hydro Electricity from hydro (TWH)
5 elec_nuc Electricity from nuclear (TWH)
6 elec_oil Electricity from oil (TWH)
7 elec_renew_other Electricity from other renewables (TWH)
8 elec_solar Electricity from solar (TWH)
9 elec_wind Electricity from wind (TWH)
10 elecprod Gross output of electric energy (TWH)
11 electric_gen_capacity Electricity Generating Capacity, 1000 kilowa…# Setting a seed to make results reproducible
set.seed("20220719")
# Using sample() to select six rows of tt$technology at random
sample_rows <- sample(x = rownames(tt$technology), size = 6)
# Creating a subset using the random rows
technology_sample <- tt$technology[sample_rows, ]
# Printing a summary of the randomly sampled subset
technology_sample# A tibble: 6 × 7
variable label iso3c year group categ…¹ value
<chr> <chr> <chr> <dbl> <chr> <chr> <dbl>
1 Pol3 % children who rec… PRY 1993 Cons… Vaccin… 6.6 e1
2 pct_ag_ara_land % Arable land shar… LBR 1991 Non-… Agricu… 3.08e1
3 fert_total Aggregate kg of fe… CHE 1988 Prod… Agricu… 1.78e8
4 railp Thousands of passe… TUR 1948 Cons… Transp… 4.9 e1
5 ag_land Land agricultural … TUN 2013 Non-… Agricu… 9.94e3
6 tv Television sets NIC 1981 Cons… Commun… 1.14e5
# … with abbreviated variable name ¹category# Adding continent and country name columns/variables to the sample subset,
# using the countrycode::countrycode() function
technology_sample <- technology_sample %>%
mutate(continent = countrycode(iso3c, origin = "iso3c",
destination = "continent"),
country = countrycode(iso3c, origin = "iso3c", destination = "country.name"))
# Selecting the country ISO code, continent and country name of the sample
# subset, to confirm that countrycode() worked as intended
technology_sample %>% select(iso3c, continent, country)# A tibble: 6 × 3
iso3c continent country
<chr> <chr> <chr>
1 PRY Americas Paraguay
2 LBR Africa Liberia
3 CHE Europe Switzerland
4 TUR Asia Turkey
5 TUN Africa Tunisia
6 NIC Americas Nicaragua Wrangling tt$technology into two electricity production tibbles: fossil fuels and low-carbon sources
# Adding the corresponding continent for each country in tt$technology;
# filtering to select for the "Energy" category; adding a more succinct
# "energy_type" variable; and dropping rows with missing values
energy_tbl <- tt$technology %>%
  mutate(continent = countrycode(iso3c, origin = "iso3c",
    destination = "continent")) %>%
  filter(category == "Energy") %>%
  mutate(energy_type = fct_recode(variable,
    "Consumption" = "elec_cons", "Coal" = "elec_coal", "Gas" = "elec_gas",
    "Hydro" = "elec_hydro", "Nuclear" = "elec_nuc", "Oil" = "elec_oil",
    "Other renewables" = "elec_renew_other", "Solar" = "elec_solar",
    "Wind" = "elec_wind", "Output" = "elecprod",
    "Capacity" = "electric_gen_capacity")) %>%
  drop_na()

# Printing a summary of energy_tbl
energy_tbl
# A tibble: 66,300 × 9
variable label iso3c year group categ…¹ value conti…² energ…³
<chr> <chr> <chr> <dbl> <chr> <chr> <dbl> <chr> <fct>
1 elec_coal Electric… ABW 2000 Prod… Energy 0 Americ… Coal
2 elec_coal Electric… ABW 2001 Prod… Energy 0 Americ… Coal
3 elec_coal Electric… ABW 2002 Prod… Energy 0 Americ… Coal
4 elec_coal Electric… ABW 2003 Prod… Energy 0 Americ… Coal
5 elec_coal Electric… ABW 2004 Prod… Energy 0 Americ… Coal
6 elec_coal Electric… ABW 2005 Prod… Energy 0 Americ… Coal
7 elec_coal Electric… ABW 2006 Prod… Energy 0 Americ… Coal
8 elec_coal Electric… ABW 2007 Prod… Energy 0 Americ… Coal
9 elec_coal Electric… ABW 2008 Prod… Energy 0 Americ… Coal
10 elec_coal Electric… ABW 2009 Prod… Energy 0 Americ… Coal
# … with 66,290 more rows, and abbreviated variable names ¹category,
# ²continent, ³energy_type
# ℹ Use `print(n = ...)` to see more rows# Filtering energy_table for fossil fuel rows
fossil_fuel_tbl <- energy_tbl %>%
filter(energy_type != "Consumption" & energy_type != "Output"
& energy_type != "Capacity") %>%
filter(energy_type == "Coal" | energy_type == "Gas" | energy_type == "Oil")
# Printing a summary of the tibble
fossil_fuel_tbl# A tibble: 13,914 × 9
variable label iso3c year group categ…¹ value conti…² energ…³
<chr> <chr> <chr> <dbl> <chr> <chr> <dbl> <chr> <fct>
1 elec_coal Electric… ABW 2000 Prod… Energy 0 Americ… Coal
2 elec_coal Electric… ABW 2001 Prod… Energy 0 Americ… Coal
3 elec_coal Electric… ABW 2002 Prod… Energy 0 Americ… Coal
4 elec_coal Electric… ABW 2003 Prod… Energy 0 Americ… Coal
5 elec_coal Electric… ABW 2004 Prod… Energy 0 Americ… Coal
6 elec_coal Electric… ABW 2005 Prod… Energy 0 Americ… Coal
7 elec_coal Electric… ABW 2006 Prod… Energy 0 Americ… Coal
8 elec_coal Electric… ABW 2007 Prod… Energy 0 Americ… Coal
9 elec_coal Electric… ABW 2008 Prod… Energy 0 Americ… Coal
10 elec_coal Electric… ABW 2009 Prod… Energy 0 Americ… Coal
# … with 13,904 more rows, and abbreviated variable names ¹category,
# ²continent, ³energy_type
# ℹ Use `print(n = ...)` to see more rows# Filtering energy_table for low-carbon energy source rows
low_carbon_tbl <- energy_tbl %>%
filter(energy_type != "Consumption" & energy_type != "Output"
& energy_type != "Capacity") %>%
filter(energy_type != "Coal" & energy_type != "Gas" & energy_type != "Oil")
# Printing a summary of the tibble
low_carbon_tbl# A tibble: 26,890 × 9
variable label iso3c year group categ…¹ value conti…² energ…³
<chr> <chr> <chr> <dbl> <chr> <chr> <dbl> <chr> <fct>
1 elec_hydro Electri… ABW 2000 Prod… Energy 0 Americ… Hydro
2 elec_hydro Electri… ABW 2001 Prod… Energy 0 Americ… Hydro
3 elec_hydro Electri… ABW 2002 Prod… Energy 0 Americ… Hydro
4 elec_hydro Electri… ABW 2003 Prod… Energy 0 Americ… Hydro
5 elec_hydro Electri… ABW 2004 Prod… Energy 0 Americ… Hydro
6 elec_hydro Electri… ABW 2005 Prod… Energy 0 Americ… Hydro
7 elec_hydro Electri… ABW 2006 Prod… Energy 0 Americ… Hydro
8 elec_hydro Electri… ABW 2007 Prod… Energy 0 Americ… Hydro
9 elec_hydro Electri… ABW 2008 Prod… Energy 0 Americ… Hydro
10 elec_hydro Electri… ABW 2009 Prod… Energy 0 Americ… Hydro
# … with 26,880 more rows, and abbreviated variable names ¹category,
# ²continent, ³energy_type
# ℹ Use `print(n = ...)` to see more rowsPlotting distributions of electricity produced from fossil fuels and low-carbon sources
# Plotting distributions of electricity produced from fossil fuels
fossil_fuel_tbl %>%
  ggplot(aes(x = fct_reorder(energy_type, value), y = value, fill = energy_type)) +
  geom_boxplot() +
  theme_solarized() +
  theme(axis.text.x = element_text(angle = 45, hjust = 1),
    legend.position = "none") +
  scale_colour_discrete() +
  scale_y_log10() +
  facet_wrap(~continent, scales = "free") +
  labs(
    title = "Electricity generated from fossil fuels by continent",
    y = "Output in log terawatt-hours: log10(TWh)",
    x = "Source")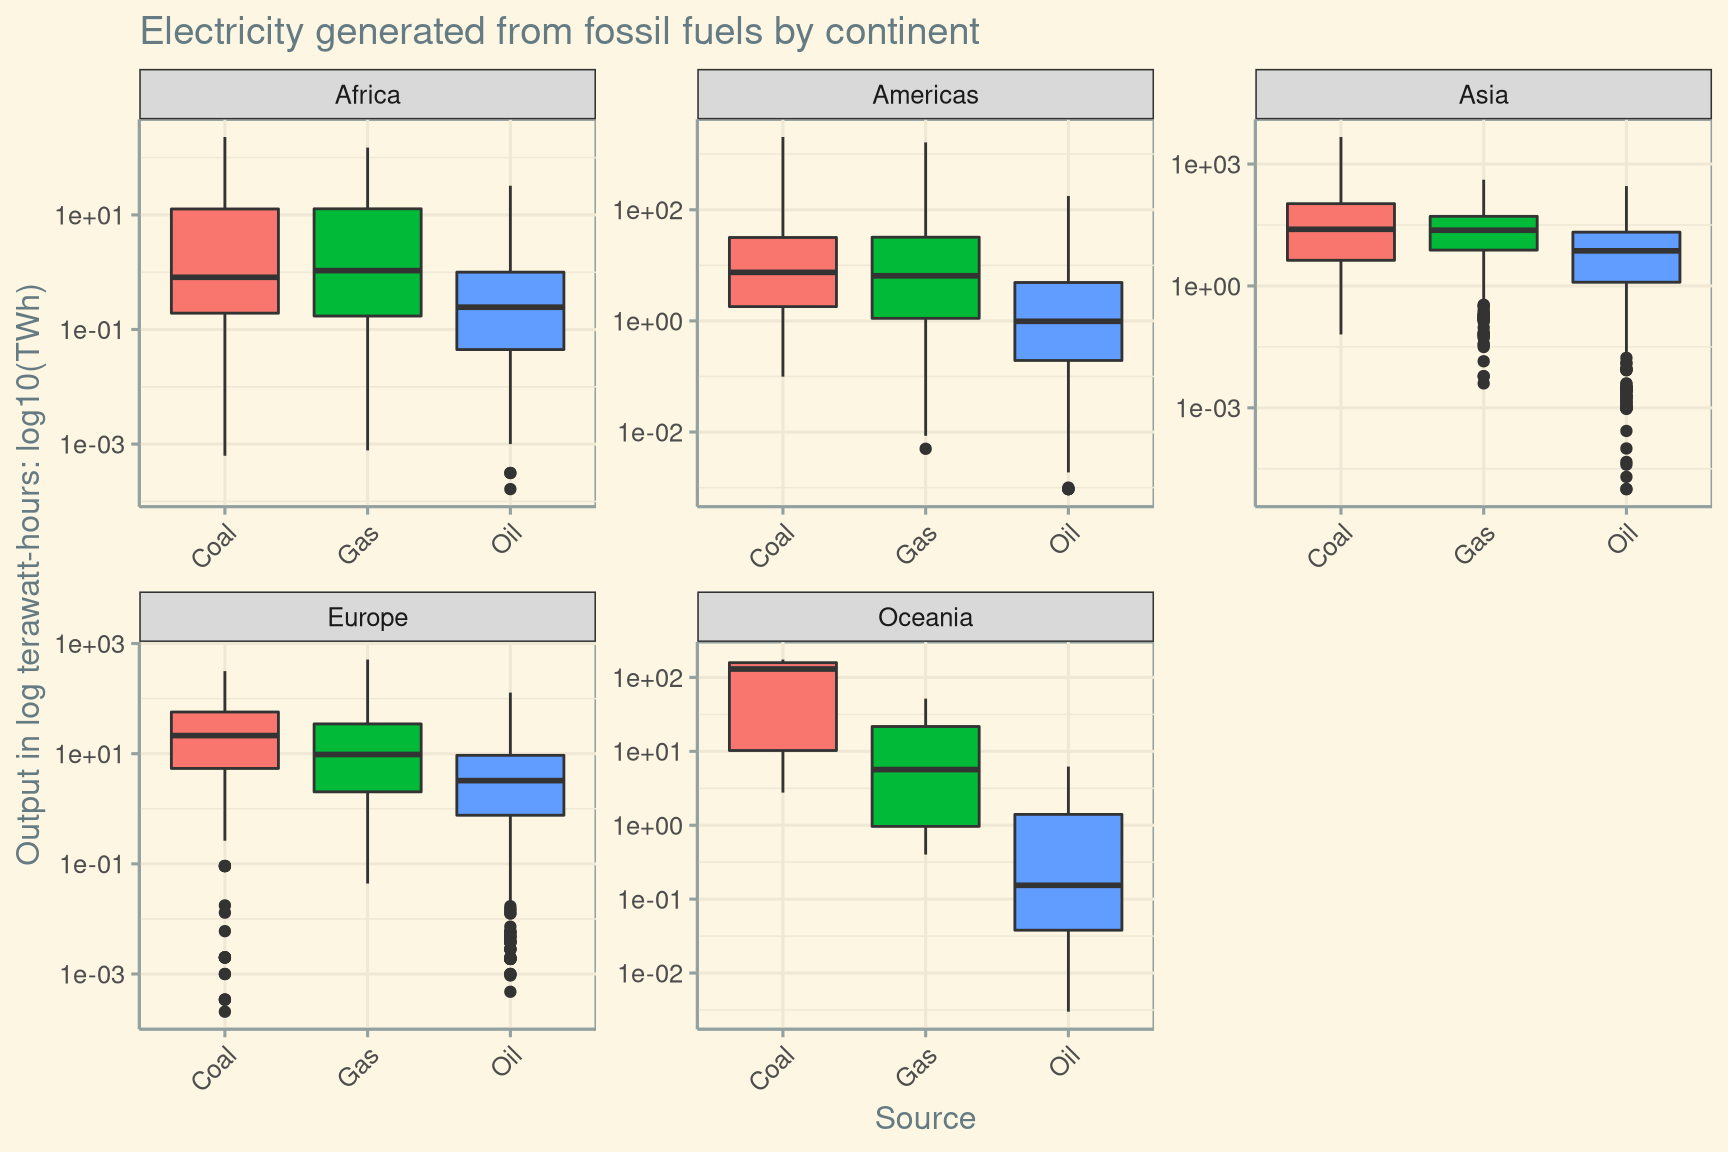
Figure 1: Box plots of electricity produced from fossil fuels, faceted by continent.
# Plotting distributions of electricity produced from low-carbon sources
low_carbon_tbl %>%
  ggplot(aes(x = fct_reorder(energy_type, value), y = value, fill = energy_type)) +
  geom_boxplot() +
  theme_solarized() +
  theme(axis.text.x = element_text(angle = 45, hjust = 1),
    legend.position = "none") +
  scale_colour_discrete() +
  scale_y_log10() +
  facet_wrap(~continent, scales = "free") +
  labs(
    title = "Electricity generated from low-carbon sources by continent",
    y = "Output in log terawatt-hours: log10(TWh)",
    x = "Source")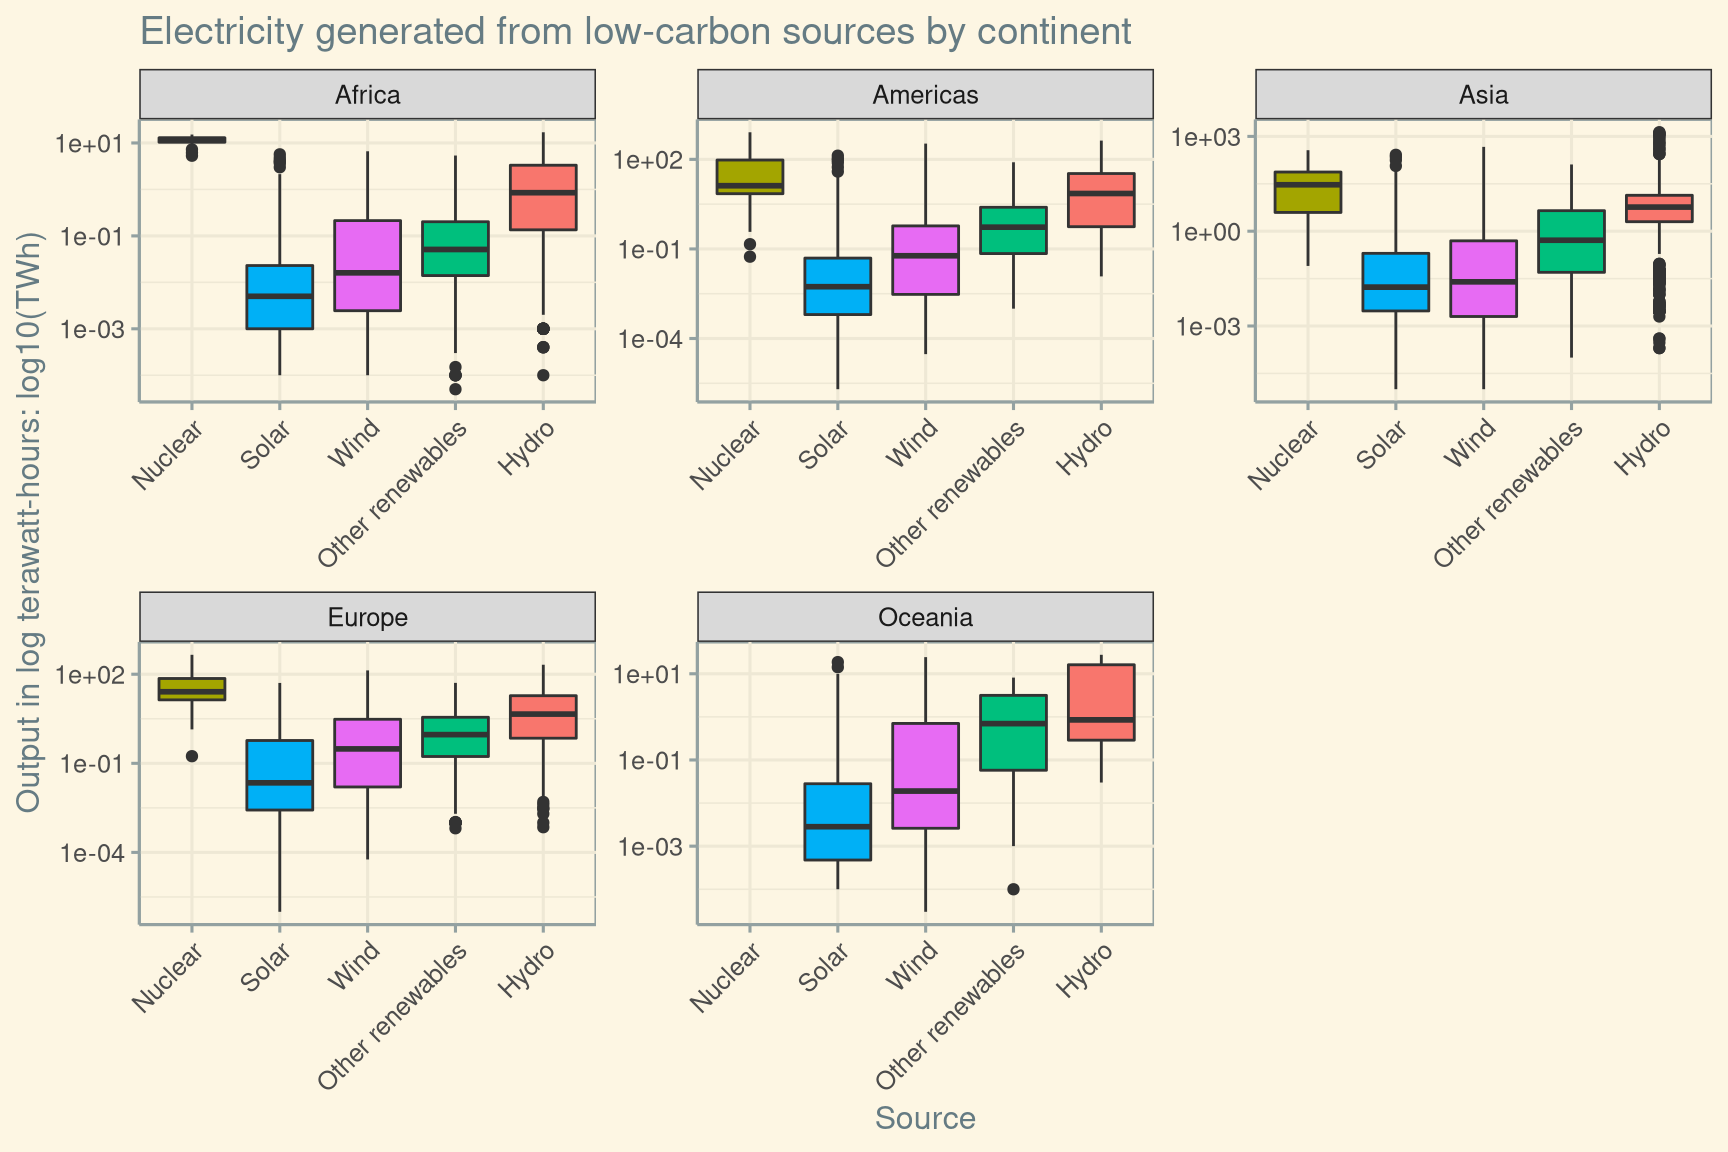
Figure 2: Box plots of electricity produced from low-carbon energy sources, faceted by continent.